FITs registration statistics for different regions of the country
The FIT register holds information about the location of each installation, so these can be analysed regionally.
Not all installations get assigned to a region, so the totals here do not add up to the totals on the register, but they account for over 80% of the total. AD systems, in particular, do not seem to have been assigned to regions, so we cannot analyse them below, and a high proportion of larger hydro systems are also not allocated.
Regional analysis by energy source
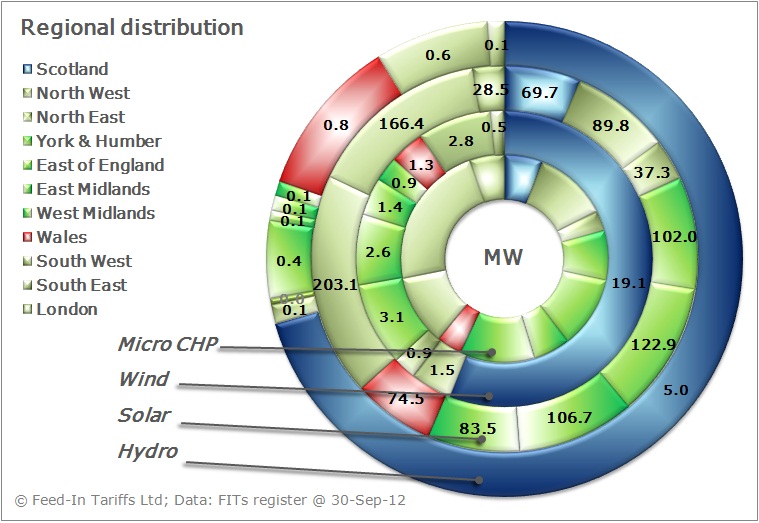
This graph allocates the capacity of each energy technology by region at the end of November 2012.
It shows that most of the wind and hydro power is in Scotland, while a high proportion of the PV capacity is in the South West and the South East.
If you find the colours hard to follow for this many areas, the regions are arranged in the same sequence as they are listed the legend, starting clockwise from the top.We won’t be updating these figures further, but wouldn’t expect the profile to change significantly.
Average system size by region
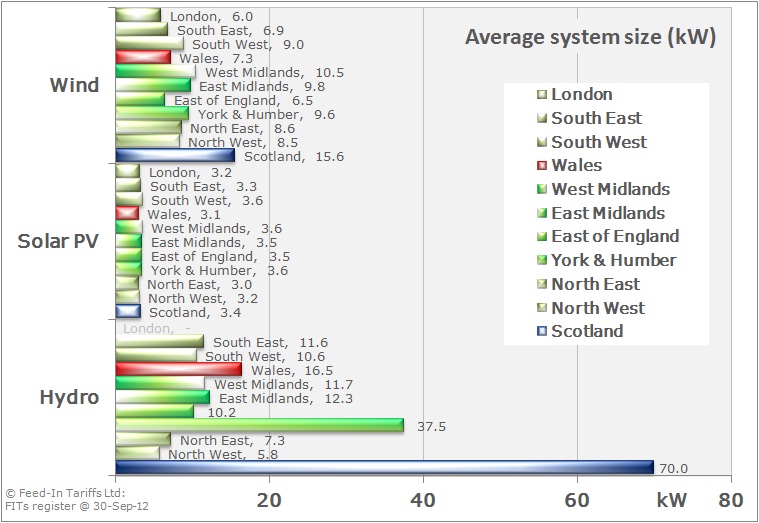 The national average system sizes are shown here, but there are some regional variations, as illustrated in this graph.