FITs registration statistics for wind energy systems
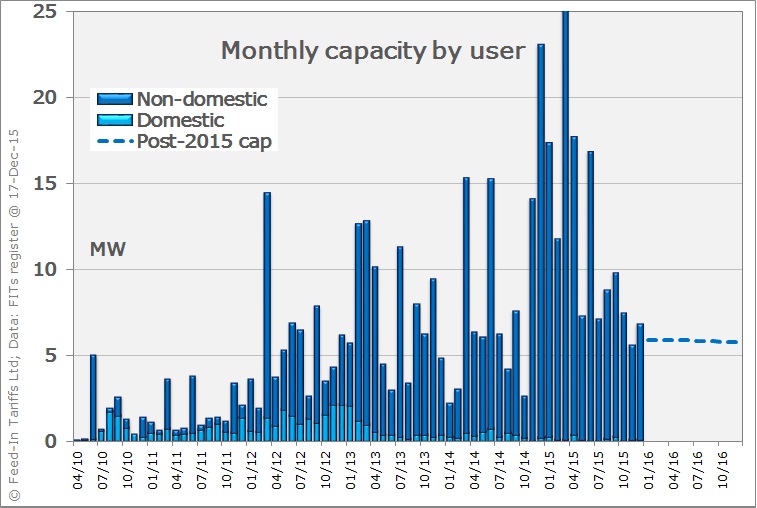
Monthly registrations
Here are the monthly megawatt volumes to the end of 2015, divided between domestic and non-domestic systems (see more about classifications here). Please remember that these are recorded at the date they are registered, not when they were commissioned (there can be quite a delay before registration – see more here).
The dotted line for 2016 shows the equivalent quarterly caps. The cumulative totals for all months are shown below.
System sizes
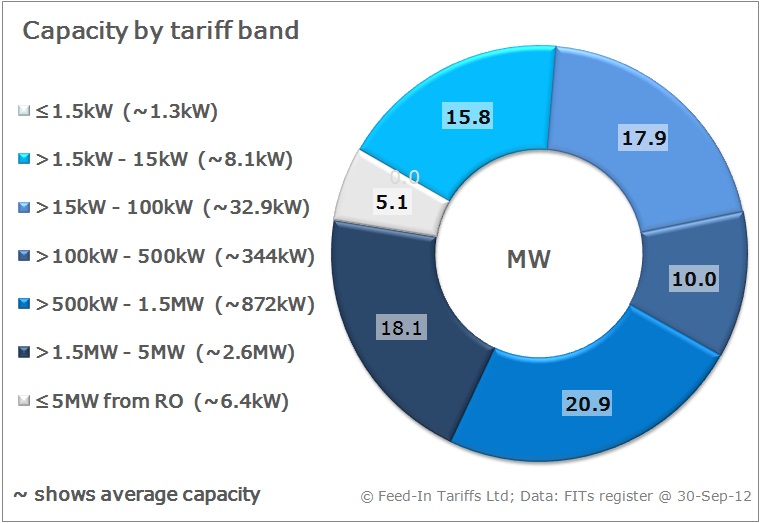
Because there are several different tariffs for wind systems, we can see what sizes of system are installed by looking at how much capacity is registered in each tariff band.
The average size of system actually registered (if any) in each band is also shown in the legend on the left.
It is too time-consuming to update this data regularly, but the general profile probably hasn’t changed much since these figures.The average sizes for wind installations (overall and for domestic and non-domestic users) are shown here, with comparisons against other FITs technologies.
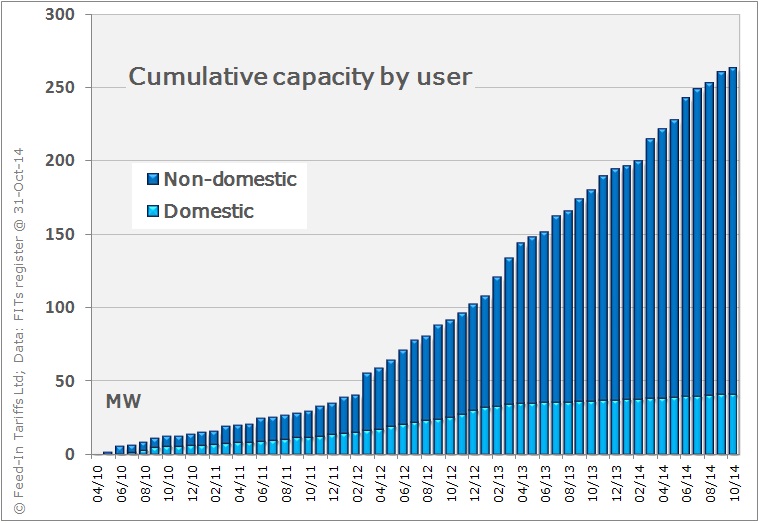 Cumulative installations
This graph shows how the overall capacity installed has grown throughout the life of the FITs scheme.
These figures have not been updated since the end of 2015 for the reasons given here.