FITs registration statistics for solar PV systems
Monthly registrations
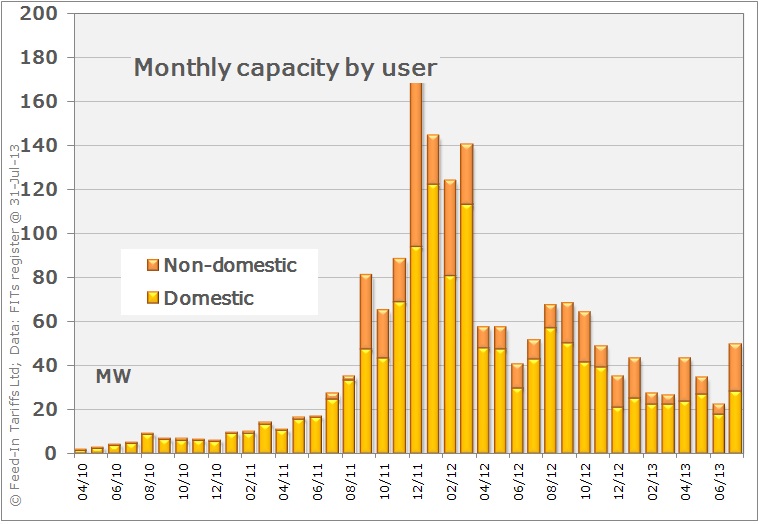
Here are the monthly megawatt volumes to the end of 2015, divided between domestic and non-domestic systems (see more about classifications here). Please remember that these are recorded at the date they are registered, not when they were commissioned (there can be quite a delay before registration – see more here).
The dotted line for 2016 shows the equivalent quarterly caps. The cumulative totals for all months are shown below.
System sizes
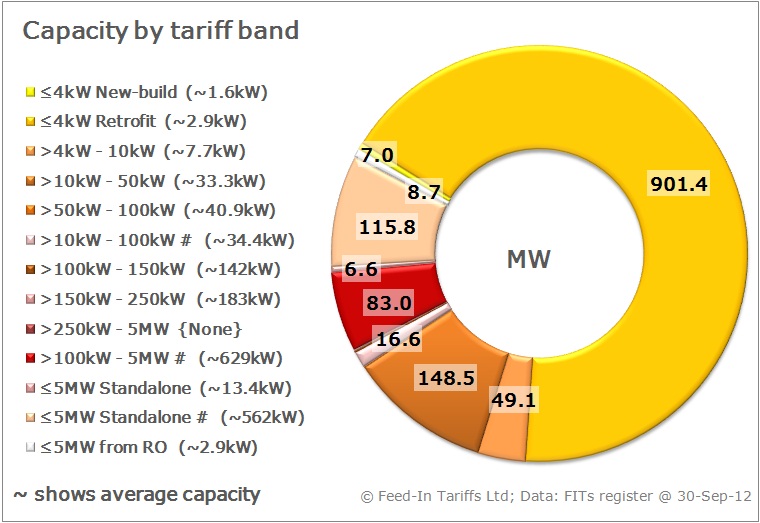
Because there are several different tariffs for PV systems, we can see what sizes of system are installed by looking at how much capacity is registered in each tariff band.
The average size of system actually registered (if any) in each band is also shown in the legend on the left.
It is too time-consuming to update this data regularly, but the general profile probably hasn’t changed much since these figures.# Tariff bands shown with this symbol were phased out in the fast-track review, and some of the bands shown were introduced at that time.
The 2011-12 comprehensive review led to most of the bands being further divided down to ‘higher’, ‘medium’ and ‘lower’ rates, as explained here. The chart above doesn’t show all those as well, because it would become too complicated. Analysis of the raw data shows that about 75% of capacity is eligible for the ‘higher’ rate, and only about 1% is registered at the ‘lower’ rate, so roughly 24% is the ‘medium’ rate (applicable to multiple owners).
The average sizes for solar PV installations (overall and for domestic and non-domestic users) are shown here, with comparisons against other FITs technologies.
 Cumulative installations
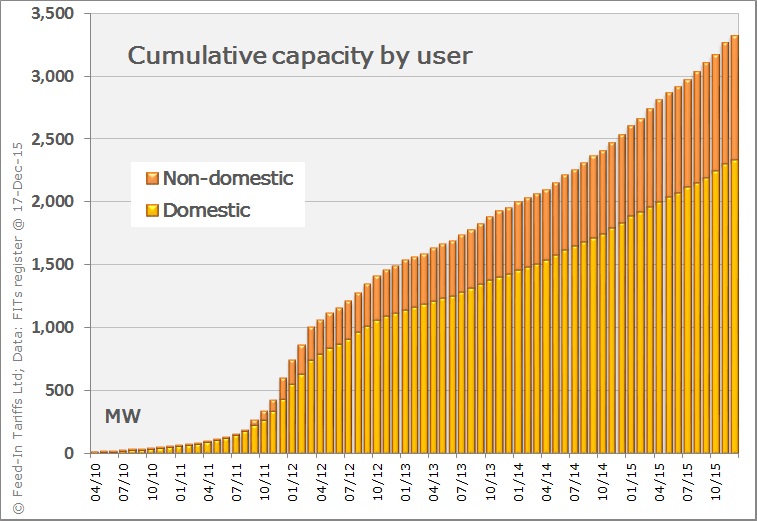
March 2012 exactly two years since FITs were introduced: PV systems registered under the Feed-in Tariffs reached 1GW! One gigawatt = 1 million kW = 1,000 megawatts.
This graph shows how the overall capacity installed has grown to approach 4GW throughout the life of the FITs scheme.
These figures have not been updated since the end of 2015 for the reasons given here.